
Meta description: Bingham County has 3.9 months of inventory and sellers are still netting 97.3% of original list — but the $105K gap between asking and selling prices tells the real story.
If you own a home in Blackfoot, Shelley, Firth, or anywhere else in Bingham County and you've been wondering whether now is the time to sell — or if you've been watching listings and wondering whether prices are finally coming down — the August numbers give you a pretty clear answer.
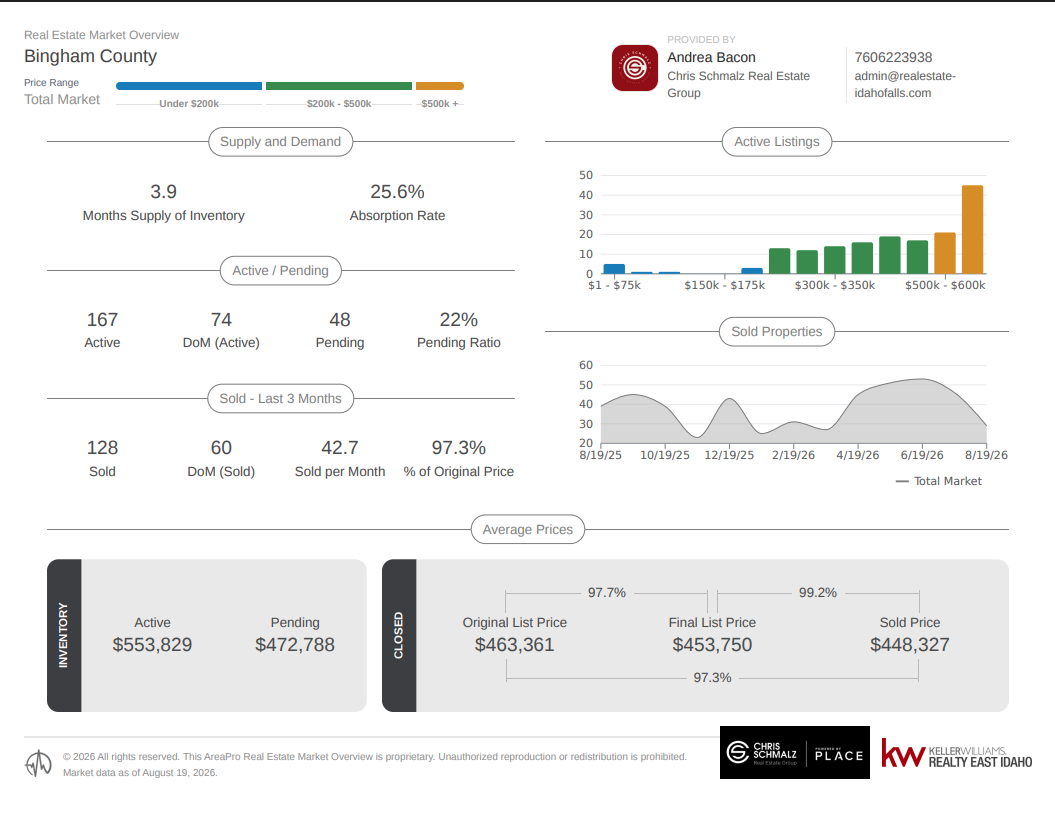
Here's what the market looked like as of August 19, 2026, and what it actually means for you.
The headline numbers
- 167 active listings countywide
- 48 pending sales, a 22% pending ratio
- 128 homes sold in the last three months — about 42.7 per month
- 3.9 months of inventory at the current pace of sales
- 60 days on market for homes that actually sold
- 97.3% of original list price — what sellers netted on average
Average sold price came in at $448,327. Average asking price on what's currently active? $553,829.
That last pair of numbers is the whole story.
What 3.9 months of inventory tells us
Months supply of inventory is just a measure of how long it would take to sell everything currently on the market if nothing new came on. Under six months has historically meant a seller's market. Over six means buyers are in the driver's seat.
At 3.9 months, Bingham County is still tilted toward sellers — but it's a long way from the two-month, multiple-offer market a lot of folks still have in their heads. Homes are selling. They're just not selling instantly, and they're not selling at whatever number the seller picks.
The absorption rate backs this up: 25.6% of available inventory is clearing each month. That's a functioning market with real demand underneath it.
The $105,000 gap
Average active list price is $553,829. Average sold price is $448,327. That's a $105,502 spread between what sellers are asking and what buyers are actually paying.
Now, part of that gap is mix — the active inventory chart shows a big stack of listings sitting in the $500K to $600K range, which pulls the average up. But part of it is straightforward overpricing, and you can see the evidence in the days-on-market numbers:
- Homes currently active: 74 days on market
- Homes that sold: 60 days on market
The listings still sitting there have been sitting longer than the ones that closed. That's not a coincidence. The market is sorting homes into two piles — priced right and priced hopeful — and the second pile just accumulates.
Sellers who price correctly are doing fine
This is the part that gets lost when people hear "the market is slowing."
Look at the pricing path on closed sales:
- Original list price: $463,361
- Final list price after reductions: $453,750 (97.7% of original)
- Sold price: $448,327 (99.2% of final list)
Total distance from original asking price to closing: 2.7%.
That is a healthy, disciplined market. Sellers who came in at a realistic number gave up less than three cents on the dollar. The average price cut was under $10,000. Buyers are not lowballing — once a home is priced where the market lives, it closes within about 1% of asking.
The pain isn't happening at the closing table. It's happening in the 74 days before a seller finally admits the first number was wrong.
What this means if you're selling
Price it right the first time. The single biggest cost in this market isn't a price reduction — it's the time you spend waiting to make one. Every week at the wrong number burns showing traffic, and by the time you correct, buyers have already labeled the listing stale.
Know your bracket. If your home lands in the $500K–$600K range, you have the most competition in the county. That's where inventory is stacked deepest. You need better preparation, better photos, and a sharper price than a seller in the $300Ks does.
Sixty days is normal now. Plan for it. If you need to be out by a certain date, we should be talking about your listing timeline months ahead, not weeks.
What this means if you're buying
You have room to work. Two years ago, asking for repairs was a good way to lose a house. Today, with 167 active listings and average time on market at 74 days, sellers who have been waiting are motivated to negotiate.
The $500K+ range is your best leverage. That's where the inventory glut is. If your budget reaches into that bracket, you have real choice for the first time in a while.
Don't confuse leverage with a fire sale. Well-priced homes are still closing at 99.2% of asking. If you find a house that's been on the market ten days and priced correctly, treat it accordingly — that one isn't waiting for you.
The seasonal picture
Sold volume peaked in June and has been tapering since. That's completely normal for Southeast Idaho — families move in summer to line up with the school calendar, and activity thins as we head into fall.
What that means practically: sellers listing right now are competing for a smaller buyer pool than they would have in May, which puts even more weight on getting the price right. Buyers, on the other hand, get less competition through the fall months. The slower season has always favored the prepared party on either side.
The bottom line
Bingham County in August 2026 is a market that rewards accuracy. There is real demand — 128 homes closed in three months and inventory is clearing at over 25% a month. But buyers have information, options, and patience, and they are not paying for optimism.
If you're thinking about selling in the next six to twelve months, the most valuable conversation you can have right now is an honest one about what your home is actually worth — not what your neighbor listed at.
Thinking about buying or selling in Blackfoot, Shelley, Firth, or anywhere in Bingham County? I've been doing this in Southeast Idaho for 25 years, and I'm happy to walk you through what these numbers mean for your specific address. No pressure, no pitch — just a straight read on your situation.
Chris Schmalz | Chris Schmalz Real Estate Group 25 years here. Still answering the phone.
Market data as of August 19, 2026, sourced from the AreaPro Real Estate Market Overview for Bingham County, total market. Figures reflect countywide averages and may not represent conditions in a specific neighborhood or price range.


